Coworking, flexible workspaces operators and their landlords and investors can benefit from using the right kind of data. Here is a tour on some of the latest sources of information on coworking and flexible workspace market and operational intelligence.
Article
What flexible workspace and coworking data can spaces and landlords immediately look at?
Existing flexible workspace and coworking market
- Looking at a single flexible workspace or coworking space data
Key operational performance metrics about a space, for instance occupancy directly reflect the profitability of the space.
For spaces who want to look at their own operations, if you are using a property management software such as OfficeRnD, Nexudus, Essensys or Cobot you will find a trove of data about your coworking or flexible workspace.
Such data include bookings and payments and sometimes the occupancy and utilisation rate, average desk rate and average rate per square feet / meter. We describe those in more details below.
However, looking at the data for one space does not tell the whole story. For instance, if occupancy is increasing, how would you know whether it is due to an initiative from the space or a general increase in the neighborhood's popularity?
- Looking at flexible workspace and coworking market data
If you would like to look at a broader picture, for instance a group of competing operators around you or for the whole city, CoworkIntel provides competitive benchmarking as a service.
This is where coworking and flexible workspace "Comp Set" data enters. A competitive set is a term coined by the hospitality sector's revenue managers. This is a group of 4 to 5 spaces, which have similar characteristics with your space.
Let us now describe the power of benchmarking tools for coworking and flexible workspace a little bit more.
What is a Comp Set?
A concept coming from the hospitality industry
First let’s wind back a bit; what precisely is a Comp Set report?
Developed by the hotel management analytics firm Smith Travel Research, the Comp Set report is a benchmarking tool that compares a hotel’s performance against a set of similar hotels.
In order to receive their STR report, hoteliers must submit performance data (like daily occupancy and Average Daily Rate) to Smith Travel Research, who then compiles all of the data they receive into the nicely presented STR reports.
CoworkIntel brings the Comp Set to flexible workspace and coworking data
CoworkIntel is bringing the Comp Set, or benchmarking-as-a-service to the world of coworking and flexible workspace data.
You can find your own flexible workspace and coworking data in your property management system, so the real advantage to looking at a Comp Set report is understanding how your space is performing against other similar properties.
To do this, CoworkIntel uses anonymized data from your competitive set, which is a group of spaces that you choose for comparison purposes. We’ll talk more about choosing a compset below.
The key metrics shown by the Comp Set report
The CoworkIntel Comp Set report uses a variety of metrics to show performance data. Here are a few of the main terms that you’ll see throughout the report:
- Occupancy = Desk Occupied / Total Number of Desks. Occupancy is expressed as a percentage, like 78%. For private offices occupancy can be calculated on a square footage or meter basis: Square Footage Booked / Total Number of Square Footage. For hot desks, one may refer to the utilisation rate by dividing the Memberships by the Total Number of Desk Desks. Similarly to gyms, hot desk utilisation can be higher than one, say 2x or 3x as not all members come on the same day.
- RevPAW (Revenue per Available Workstation) = Total Revenue / Total Number of Workstations. RevPAW can also be calculated as the Average Price per Desk (APD) x Occupancy. RevPAW is the average desk rate sold for a given time period.
- Revenue per Square Foot (or Square Meter) (RFS) = Total Revenue / Number of Square Footage Sold.
- Average Length of Subscription (ALOS). This metric identifies the average length of subscription of your members, which is calculated by dividing the total occupied desks days by the number of subscription.
You’ll also see your space’s performance compared to an index, which shows you whether your space is performing better or worse than average within your competitive set. The index is calculated by averaging your competitive set’s data. for occupancy, for example: the average of all the competitive set’s occupancy numbers. Reading it is easy:
- If your space scores higher than the index, then you’re outperforming your compset, or capturing more than your fair share.
- If your index is below the index, then you’re not earning your fair share and have some room to improve.
How to pick your Comp Set?
Pick comparable spaces
In order for the Comp Set to provide relevant information, you need to select an appropriate group of competitors. You should pick a compset that most closely resembles your flexible workspace or coworking type. A strong compset should include 4 to 5 spaces with the following characteristics:
- Located within the same geographical area, exceptions could be for spaces located in very remote areas or certain airport spaces, which compete with different markets
- Selling similar rates
- Offering similar amenities
- Targeting the same type of members, for example, a space intended for large corporate will not want to include spaces with a focus on hot desks
You can always change them later
Keep in mind that you can always change your competitive set, so it’s okay if your first iteration isn’t perfect. Let’s now look at how you can gain insights from your Comp Set report.
How to Read Your Comp Set Report
Once you’ve chosen a solid competitive set and have received your new report, it’s time to dive into the data. But with so many numbers to look at, where do you start? We’ll explain a few strategies to reading a Comp Set report effectively.
Look for trends
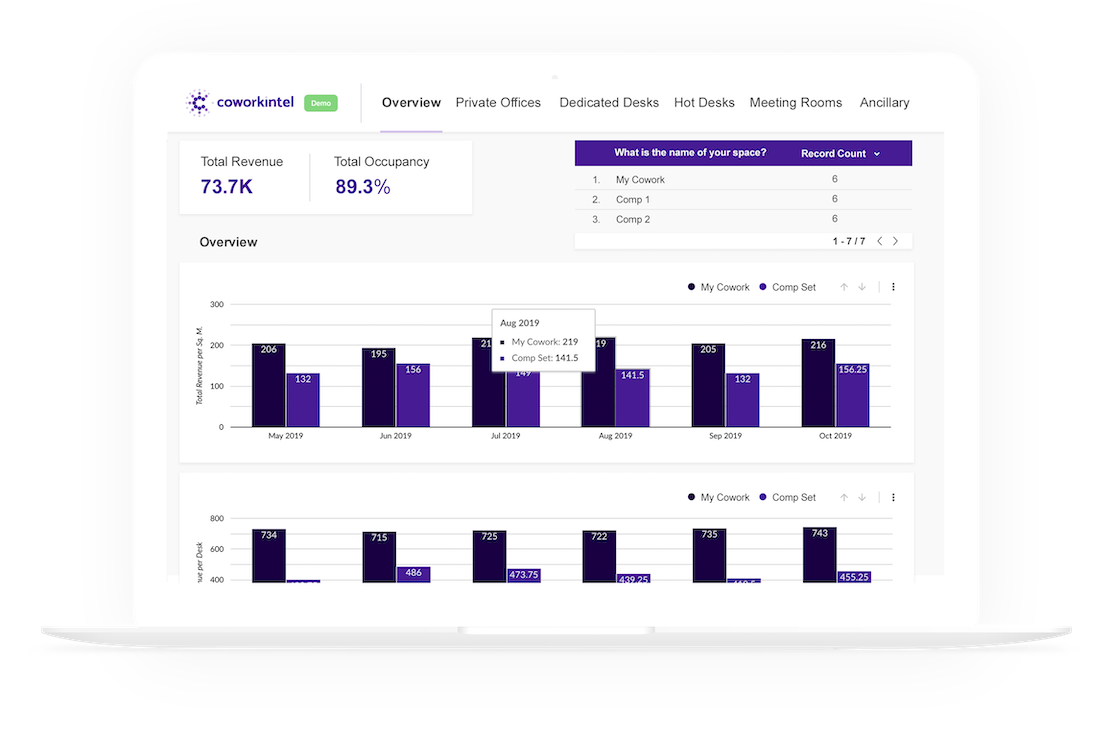
Let’s start on the “Overview” page, which is the first one. On this sheet, you’ll see occupancy, Revenue per Square Foot, and RevPAW broken down by each month of operation. There’s a bar for you and your compset. Again, if your number is over the index, you’re doing better than your compset average, and if it’s below it, you have room to grow.
By taking a quick look at this sheet, you can easily see if your indices are above or below the Comp Set, in general, as well as if your performance changed positively or negatively over the last months. What trends do you see? Is your performance up or down? How about your compset? Is a particular Month of the Year performing better than others?
Compare to last year and try to make inferences
Looking at the percent change compared to last year can also provide insight into your performance. By looking at the RevPAW totals, you can get a quick snapshot into your space’s and your compset’s year-over-year performance for that month.
Did the month perform better in 2020 than 2019? Or worse? And was your performance in line with the compset or different? Think about why that could be, perhaps a special event happened last year that didn’t return this year, or maybe several new spaces opened in the area which could lead to lower occupancy overall (or higher by creating momentum).
On subsequent sheets you can explore further into your year-over-year trends to pinpoint which segments were affected. For example, maybe your occupancy for private offices stayed the same, but your dedicated desks occupancy decreased.
When you look on your “Private Offices” sheet, you might notice that your Comp Set Revenue per Square Footage grew while your Occupancy decreased. This means that your competitors are making a more profitable use of their Private Offices. Could this be an opportunity for you? Knowing this, you could start to brainstorm strategies to attract higher-paying private offices members.
Take notes in your analysis so that you can track insights over time
As you study your Comp Set report, we recommend taking a lot of notes about your observations and explanations. You might add notes about a company meeting room booking that cancelled last minute as a cause for low revenue numbers, or maybe a spaces next door had a power outage and you received a lot of unexpected business that led to higher RevPAW on a particular date. A year from now, when you wonder why your year-over-year numbers look the way they do, you can look back and thank yourself for taking detailed notes!
Identify unseen value drivers
CoworkIntel Comp Set report flexible workspace and coworking data contains a tab describing Ancillary Services. These are everything that are not a desk: events, virtual offices, coffee and bar, etc. The report contains a filter as shown below enabling you to make sure you are comparing like-for-like between your Comp Set and you.
Could you make a quick revenue increase by increasing the coffee price? It also enables you to identify the services offered on the market but not in your space. Are you leaving money on the table by not offering virtual offices? Some spaces cover their rent with virtual offices only!
The airline industry offers interesting examples of ancillary services strategy.
Increase retention
The Comp Set report shows the Average Length of Subscription (ALOS). This metric identifies the average length of subscription of your members, which is calculated by dividing the total occupied desks months by the number of subscription. A higher number is better, as a low LOS metric means reduced profitability due to increased labor costs. For example, 6 one-month hot desks require more labor costs than serving one 6-month dedicated desks, even through the total desks bookings are the same.
If your LOS metric shows that for a certain time period you are accommodating more short-term subscription than usual, then you can make revenue management adjustments and maybe increase your short-term rate while offering a higher discount for 2+ month memberships. Similarly, if you have a slow month in the year (usually August), you can place a minimum LOS restriction on August, channeling more 2+ months members to your demand pool and helping your slow months.
While the Comp Set report shares a lot of valuable data, it’s purely quantitative. It tells us the “what” but not the “why.” To really understand what’s happening in your space’s performance and the market, you’ll want to dig into the “why” behind the data. Coupling your findings from your Comp Set report with insight from a business intelligence tool or advisor can help you develop more effective strategies to capture even more of your fair share.
Where can I see a live demo of coworking and flexible workspace data?
You can simply request access for free.
CoworkIntel shows the "what" and marketing and payment analytics show the "why"
CoworkIntel Comp Set reports are a rich source of insights but it’s important to remember that they don’t always tell the complete story. A flexible workspace or coworking manager should have more tools in his or her toolbox to interpret data, such as communication analytics and subscription analytics to further explain the information that a Comp Set report provides.
Marketing and Payment Analytics
A web marketing analytics tool that pulls information from your online presence and communication can be the key to understanding your space’s performance. When you use a communication analytics tool like MixMax alongside your Comp Set report, your Comp Set numbers will make more sense within the context of your space’s full performance data.
For instance, you can pull up your current promotion performance. Maybe this year’s beginning of the year email campaign didn’t see as strong of results as last year’s, so that could be the reason why your January occupancy was lower than last year in the Comp Set report.
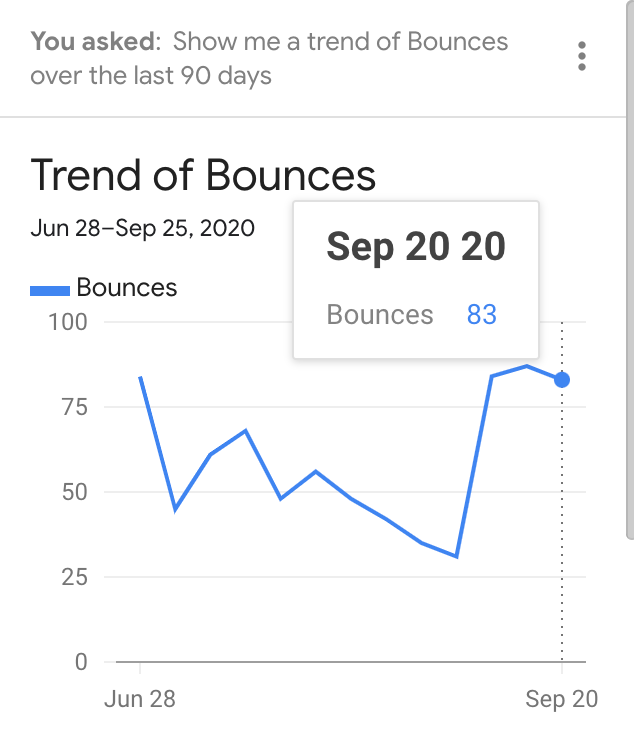
Adding a Google Tag to your website and looking at Google Analytics is also a great way to measure the performance of your website. For instance, how is your main page bounce rate evolving over time? The bounce rates represents the percentage of visitors who enter the site and then leave rather than continuing to view other pages within the same site. A higher bounce rate may mean that your first page does not attract enough the eye.
Could more appealing visuals help? More information on marketing analytics strategy can be found online.
Google Analytics also has a benchmarking option, so that you can look at the relative performance of your physical presence on CoworkIntel’s report and your online one on Google Analytics. The follow video shows where the benchmarking feature is located.
A payment analytics service like Chargebee (https://www.chargebee.com), which integrates nicely on top of Stripe (https://stripe.com/), can also provide valuable information about your spaces - in real-time. There’s no need to wait a month until the new CoworkIntel report comes out; if you notice that your space is losing RevPAW to the compset, you might want to see exactly what subscriptions are driving your figure.
Maybe one member with a lower discount is getting to the end of its contract and you might want to consider offering a higher discount to keep occupancy at the Comp Set level or try to attract higher margin members. Again, Chargebee also has benchmarking features and is thus a great complementary tool to CoworkIntel flexible workspace and coworking data.
A good revenue manager knows her way around a CoworkIntel report, but a great revenue manager uncovers insights from multiple sources to paint a holistic picture and uncover trends. By reading a Comp Set report and studying the trends and year-over-year changes, then comparing the data to your own property performance with a BI tool or compset rates with a rate shopper, you can take your revenue management strategy to the next level.
Who is the reference data provider for flexible workspace and coworking?
CoworkIntel is the reference competitive intelligence provider for flexible workspace and coworking pricing and occupancy data. CoworkIntel brings the power of hotel-inspired Comp Set to the world of flexible workspace and coworking.
Update as of August, 18 2021:
In this section, we will keep a structured list of the flexible workspace and coworking data tools that offer benchmarking as a feature:
- CoworkIntel Comp Set Report (local benchmarking)
- CoworkIntel Flex Intel (broader market data and trends)
- CoworkIntel White Space (potential for coworking and flexible workspace in secondary cities and suburban areas)
- CoworkIntel Social Intel (social media benchmarking)
- CoworkIntel Web Intel (website traffic)
- CoworkIntel Occupier Intel (coworking and flexible workspace data on occupiers)
- CoworkIntel Landlord Intel (data on property owners)
- Google Analytics (web marketing)
- Chargebee (subscription)